How Should You Measure Trade Show Success? The Metrics Exhibitors and Organizers Actually Need
Badge scans and business card counts are not trade show ROI metrics. Here are the numbers exhibitors should track — hot lead ratio, pipeline, cost per lead — and what organizers should watch instead.
After every trade show, someone asks the same question: "How many business cards did we collect?" The moment that number becomes the definition of success, booth operations start to bend around it — usually in the wrong direction. Measuring trade show ROI is not about counting contacts; it is about measuring lead quality and making that quality comparable in numbers. Exhibitors should track hot lead ratio, deal-value pipeline, and cost per qualified lead. Organizers should track performance distribution across exhibitors, hourly traffic peaks, and visitor-type mix. This article walks through each metric, how to calculate it, and what decision it supports.

Why "How Many Cards" Is a Broken Metric
Card count is the easiest number to measure, and that is exactly the problem. When the easiest number becomes the target, teams optimize for it.
You can predict what happens at a booth whose KPI is contact volume: a prize wheel to build a line, giveaways handed to anyone walking past, badges scanned indiscriminately. The number goes up. But inside that pile of contacts, the buyer with a live purchasing project and the visitor who came for the tote bag are indistinguishable. Sales sends the same blast email to hundreds of leads, response rates crater, and at next year's budget meeting someone concludes that "trade shows don't work." That conclusion is wrong — but the measurement made it inevitable.
Now compare that with a booth where every conversation is logged with a lead temperature (hot, warm, cold), a visitor type, products of interest, and an estimated deal size. Suddenly you can demonstrate, in numbers, that 20 hot leads beat 300 anonymous cards. When you measure quality instead of volume, the operating goal of the booth shifts from "collect more" to "have better conversations" — which is the outcome you actually wanted.
What Metrics Should Exhibitors Track?
From the exhibitor's side, trade show ROI reduces to one question: did the money we spent on this event come back as pipeline? Answering it takes five metrics.
Hot lead count and ratio
The share of conversations that qualified as hot matters more than the total. A booth with 100 conversations and 5 hot leads underperformed a booth with 40 conversations and 15. Hot lead ratio also works as a diagnostic: it reflects booth placement, pre-show marketing, and staff skill all at once. A low ratio usually means "plenty of traffic, wrong audience" — a targeting problem, not an effort problem.
Deal-value pipeline
If each conversation records an estimated deal size, you can total the pipeline the event generated. At international shows where quotes land in several currencies, keep the totals separated by currency rather than force-converting them. Pipeline is not revenue yet, but it is the first number you can put directly next to your participation cost.
Cost per qualified lead
Total participation cost divided by the number of qualified leads. A worked example — note these are illustrative figures, not industry statistics:
- Total cost: $8,000 booth fee + $7,000 in build-out, staffing, and travel = $15,000
- Qualified leads (hot + warm): 60
- Cost per qualified lead: $15,000 / 60 = $250
The absolute number matters less than the comparison. If Show A costs $250 per qualified lead and Show B costs $600, you have a defensible basis for next year's budget allocation. One caution: if the denominator is "all badge scans," the metric is corrupted again. Use temperature-filtered qualified leads only.
Follow-up conversion rate
Track whether the next steps promised on the show floor — quote sent, samples shipped, meeting booked — actually happened, and how many advanced to the next stage. This metric grades your post-show process rather than the show itself. Lots of hot leads but weak conversion means the problem is your follow-up, not the event.
Event-over-event comparison
None of the metrics above reach full value until you record them in the same format across events. Putting this year's conversation count, hot lead ratio, pipeline, and cost per lead next to last year's — and next to other shows — is what finally answers the recurring question: which events deserve a booth again next year?
What Metrics Should Organizers Track?
Organizers measure a different thing. For an organizer, trade show ROI means "did exhibitors get results strong enough to re-book?" — and managing that requires data that spans the whole event.
Performance distribution across exhibitors
A strong event-wide conversation total can hide a dangerous pattern: results concentrated in a handful of booths. If the top 10% of exhibitors captured half the meetings while the rest sat idle, the quiet majority will not return next year. An exhibitor ranking exposes this concentration early and gives you evidence for fixing floor layout, traffic flow, or buyer-matching programs before renewal season.
Hourly peaks
Conversation volume by hour reveals the event's rhythm. If mornings are dead and activity spikes between 2 and 4 p.m., that points to concrete operational changes — adjusted opening hours, stronger morning programming, better session scheduling. Exhibitors benefit from the same data when planning staffing for the next edition.
Visitor-type mix
The share of attendees who are genuine buyers with purchasing authority is the number organizers should watch most closely. When conversations carry a visitor type, you can state "X% of recorded interactions were with buyers" as a fact — and that single figure becomes your strongest asset when selling booth space for next year.
Evidence for re-booking
Before asking an exhibitor "will you join us again?", imagine showing them their own numbers first: conversations held, temperature distribution, pipeline generated at your event. Renewal conversations built on performance data close very differently from ones built on a satisfaction survey.

The Metrics at a Glance
| Metric | How to calculate | Who uses it | What decision it supports |
|---|---|---|---|
| Hot lead ratio | Hot leads / total conversations | Exhibitor | Audience fit and conversation quality |
| Deal-value pipeline | Sum of estimated deal sizes, per currency | Exhibitor | Opportunity size vs. participation cost |
| Cost per qualified lead | Total cost / qualified leads | Exhibitor | Budget allocation across events |
| Follow-up conversion | Advanced leads / qualified leads | Exhibitor | Health of the post-show process |
| Exhibitor performance distribution | Ranking by conversations and deal value | Organizer | Floor layout and matchmaking fixes |
| Hourly peaks | Conversations logged per hour | Organizer, exhibitor | Operating hours and staffing |
| Visitor-type mix | Share of conversations by visitor type | Organizer | Proof of buyer quality for sales |
| Daily trend | Conversations per event day | Organizer, exhibitor | Event length and programming |
None of This Works Without Structured Capture
At this point a fair objection appears: "Sounds great, but our show-floor records are a notebook and a stack of business cards." Exactly — and that is the real constraint. Not one metric above can be computed from free-form notes.
A note that reads "asked for quote, positive, call next week" is perfectly readable to a human and completely useless to an aggregation. Hot lead ratio requires every conversation to carry a temperature value on the same scale. Pipeline requires deal sizes entered as numbers with a currency attached. Hourly peak charts require timestamps recorded in the event's local timezone. In other words, the success of trade show measurement is decided not during post-event analysis but at the moment each conversation happens — either structured data gets captured then, or the metric is gone forever.
That makes the sequence matter. Choose your metrics first, then bake the fields those metrics need — temperature, visitor type, products of interest, deal size, next step — into the capture screen your booth staff uses. The staff never has to think about metrics. They tap a few buttons per conversation, and the metrics assemble themselves afterward.
Reports That Build Themselves as Conversations Accumulate
TagBooth turns this exact workflow into a product: a QR and NFC tag-based lead capture service for trade shows. One tap on the booth tag opens a capture screen with structured fields — lead temperature, star rating, visitor type, products of interest, next steps, and deal size in any of eight currencies — with every entry timestamped in the event's timezone automatically.
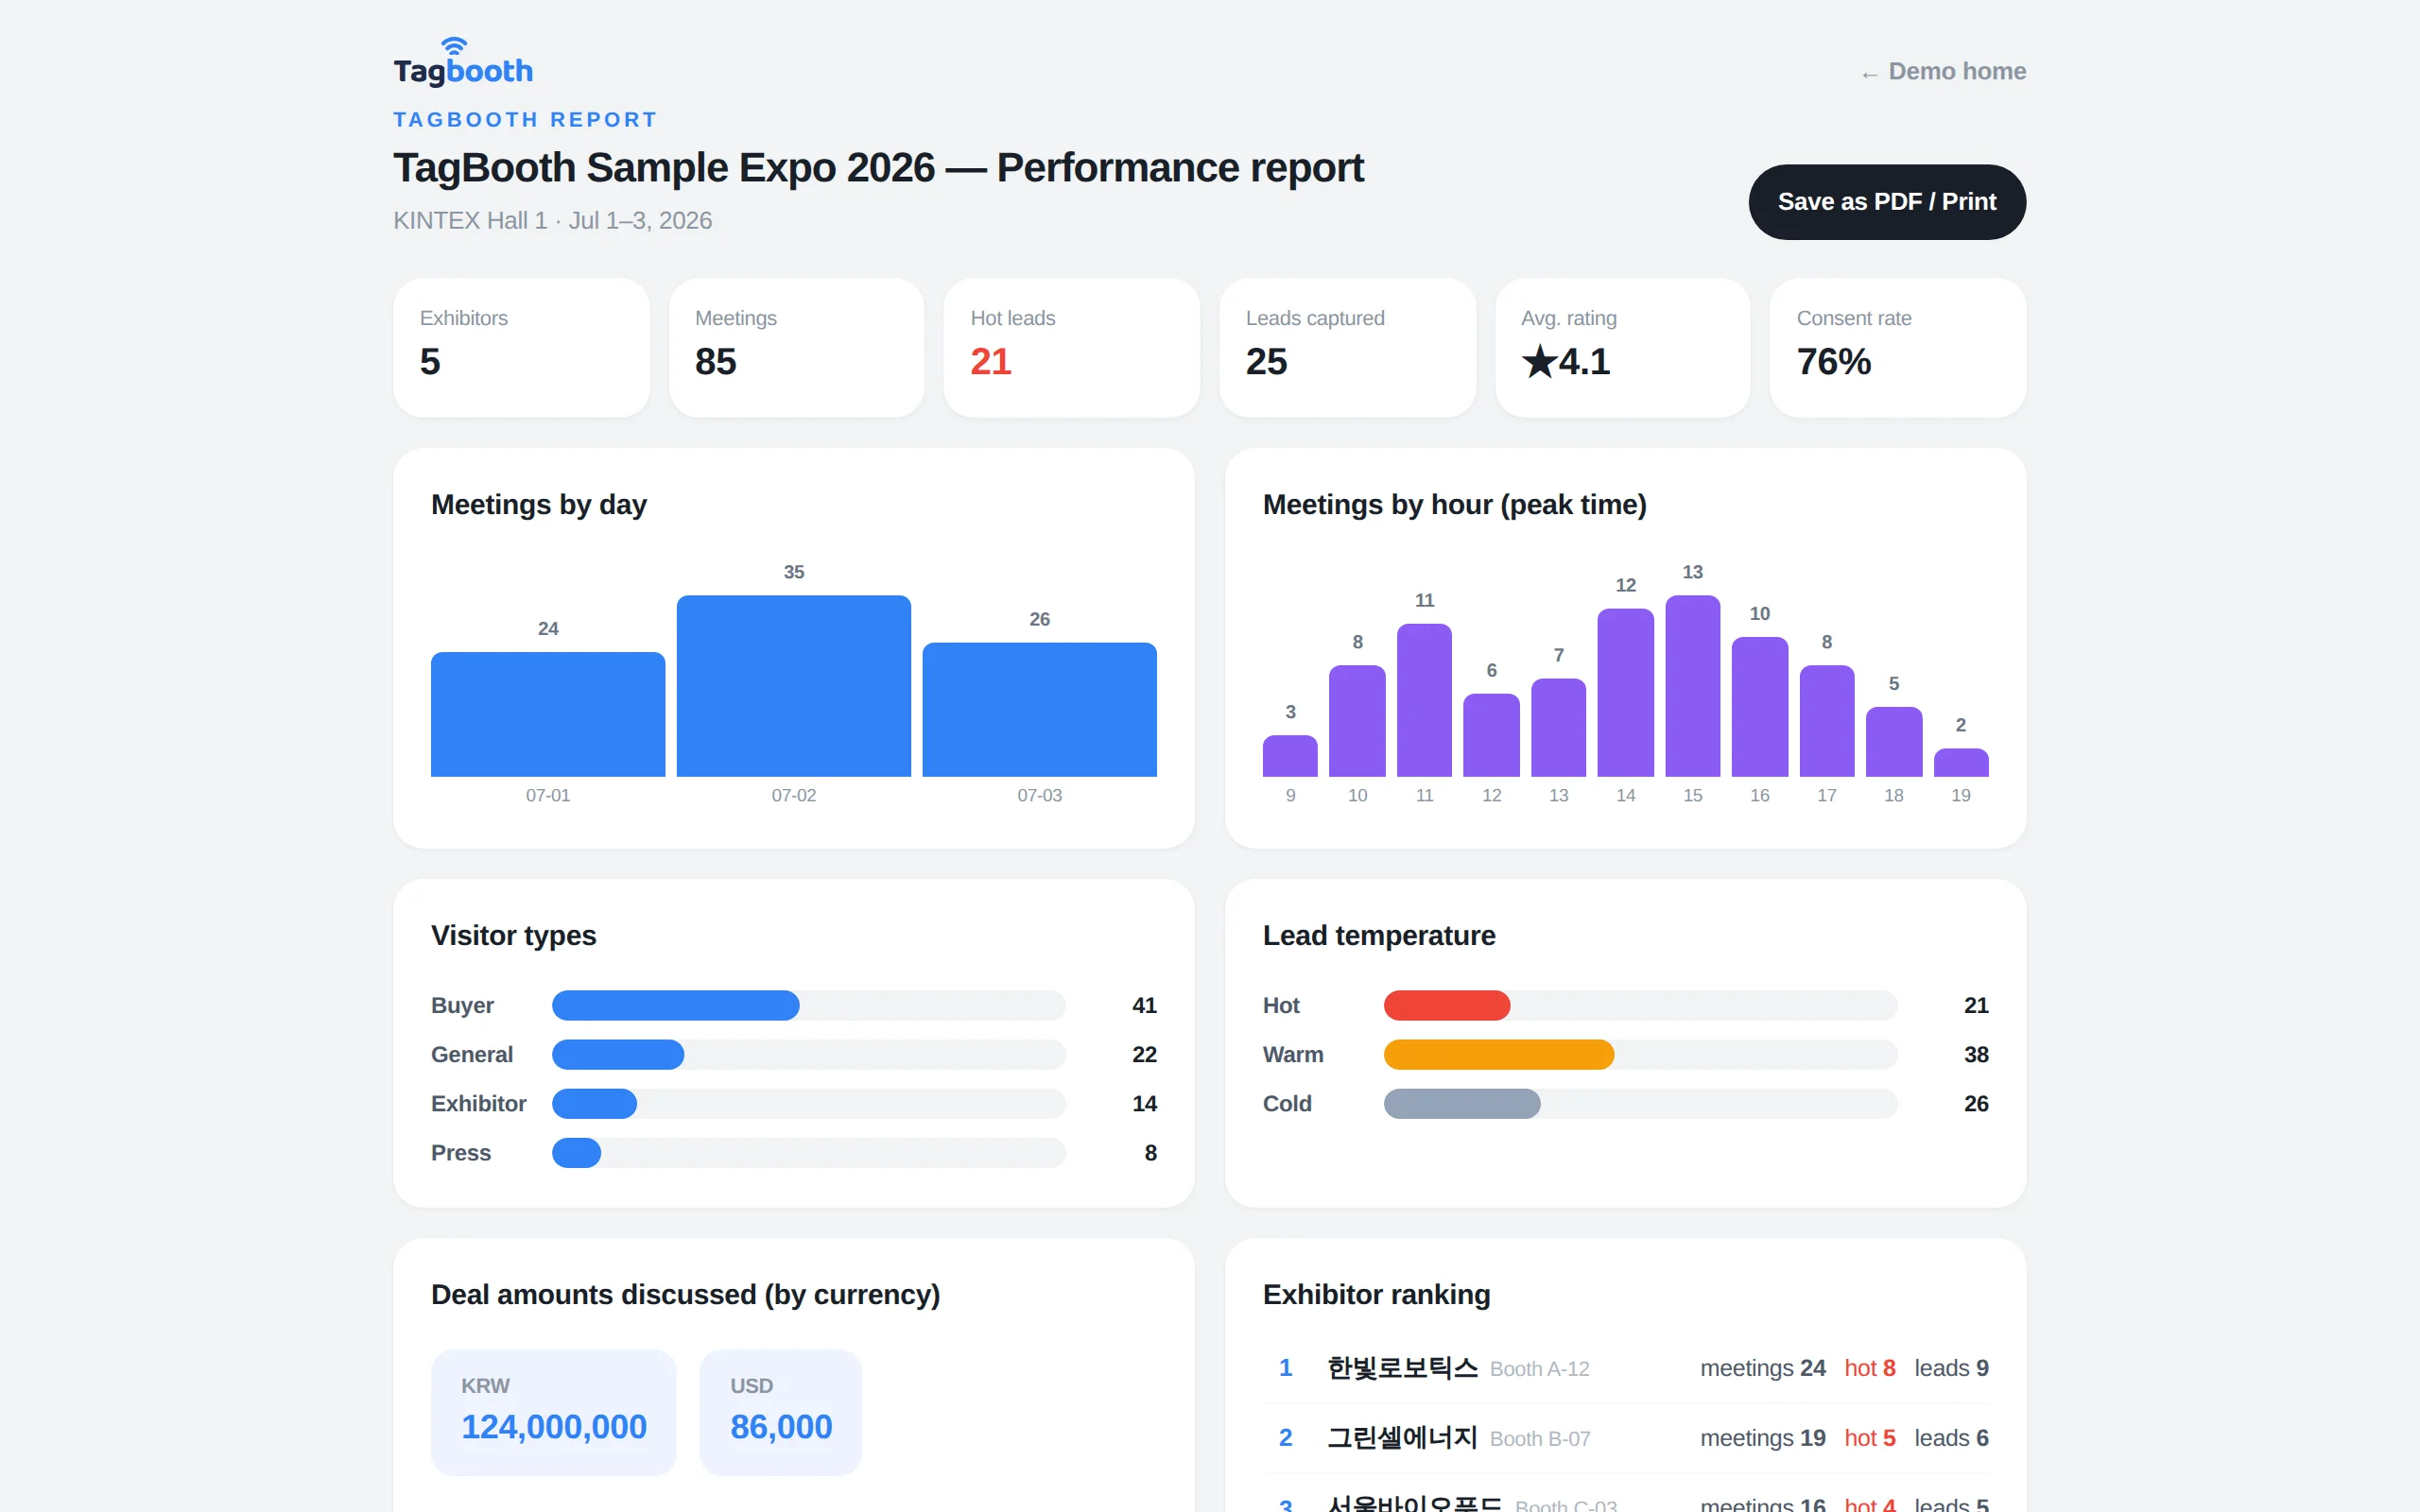
As conversations accumulate, the event performance report generates itself: daily trend chart, hourly peak-time chart, visitor-type distribution, lead temperature distribution, deal totals per currency, and an exhibitor ranking — most of the metrics in this article, with no spreadsheet work. The organizer-event-exhibitor structure means organizers see the aggregated view across the whole event while each exhibitor sees their own booth's results. Reports print to PDF for formal submissions, and the full detail exports to Excel (CSV) so your team can carry qualified leads straight into follow-up and deal tracking. Try it without installing anything on the demo, or see the full workflow on the how it works page.
FAQ
Can I even calculate trade show ROI before deals close?
Waiting for closed revenue often means waiting months — long past the deadline for deciding on next year's events. The practical approach is two-stage: evaluate immediately with leading indicators such as hot lead ratio, pipeline total, and cost per qualified lead, then validate later by tracking closed deals in your exported spreadsheet.
What is a good cost per qualified lead?
There is no universal benchmark — it varies enormously by industry and average deal size. What matters is comparing figures calculated the same way across events and years. A common approach is to estimate a lead's expected value from your historical close rate and average order value, then concentrate budget on events whose cost per lead falls below it.
As an organizer, how do I get exhibitors to actually log conversations?
Make the payoff immediate. When exhibitors see in the pre-show briefing that every logged conversation feeds their own auto-generated performance report — ready for follow-up the day the show ends — participation changes noticeably. The capture itself also has to be a few taps at most, or it will not survive peak traffic.
How should we define hot, warm, and cold?
A one-line definition agreed before the show is enough. For example: hot means stated purchase intent with quantities or timing, warm means genuine interest without a timeline, cold means information gathering. The specific wording matters less than consistency — everyone scoring on the same scale, immediately after each conversation, is what makes the ratio trustworthy.